Navigate Data-Driven Insights: Explore SaaS Trends Through Interactive Graphs for Informed Decision-Making.
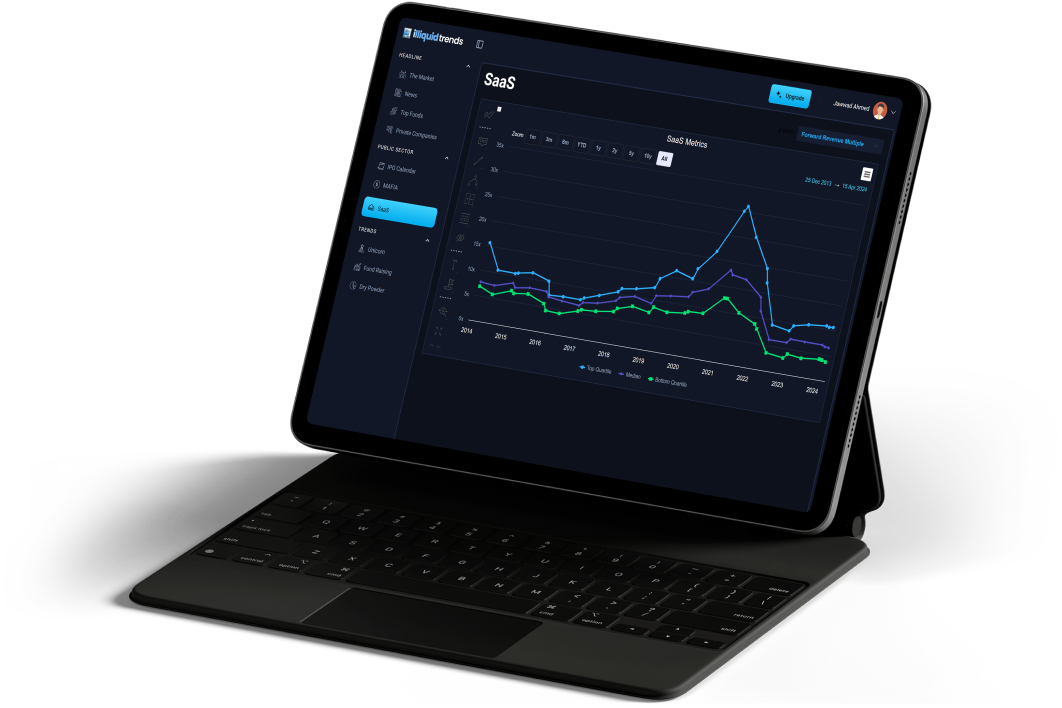
Intuitive features put you in control of full market data. See more of what matters to you, in less time.
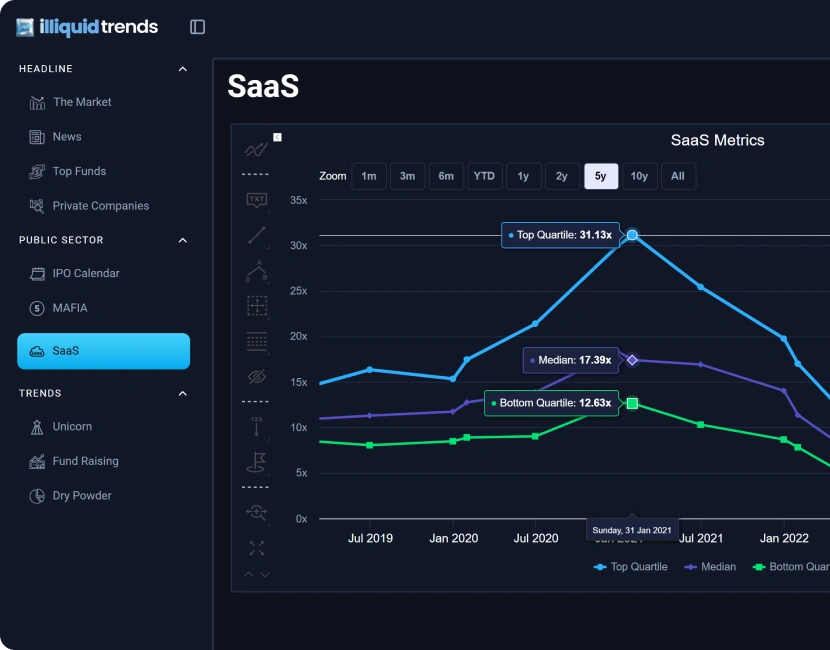
Dive into the Forwards Revenue Multiple metric with our interactive graph. Understand how investors value future revenue streams, track valuation trends, and identify market sentiment towards SaaS companies.
Create graph templates in a flash and share them at will.
Customize charts to suit your investment style.
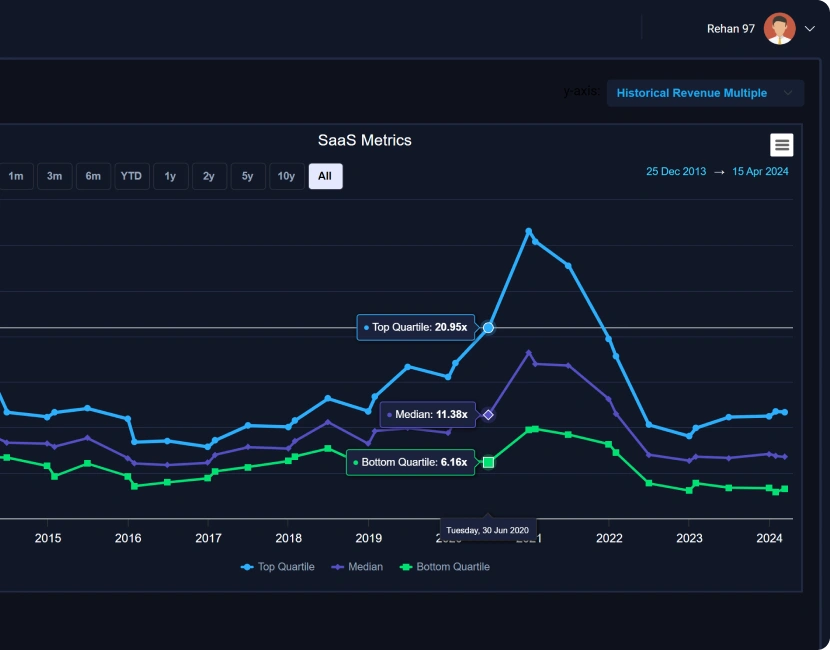
Explore the Historical Revenue Multiple metric through our interactive graph. Gain insights into past valuation trends, compare performance across time periods, and assess the evolution of SaaS company valuations.
Create graph templates in a flash and share them at will.
Customize charts to suit your investment style.
Analyze Revenue Growth trends with our interactive graph. Track revenue expansion rates, assess growth trajectories, and identify high-growth SaaS companies driving market innovation.
Create graph templates in a flash and share them at will.
Customize charts to suit your investment style.
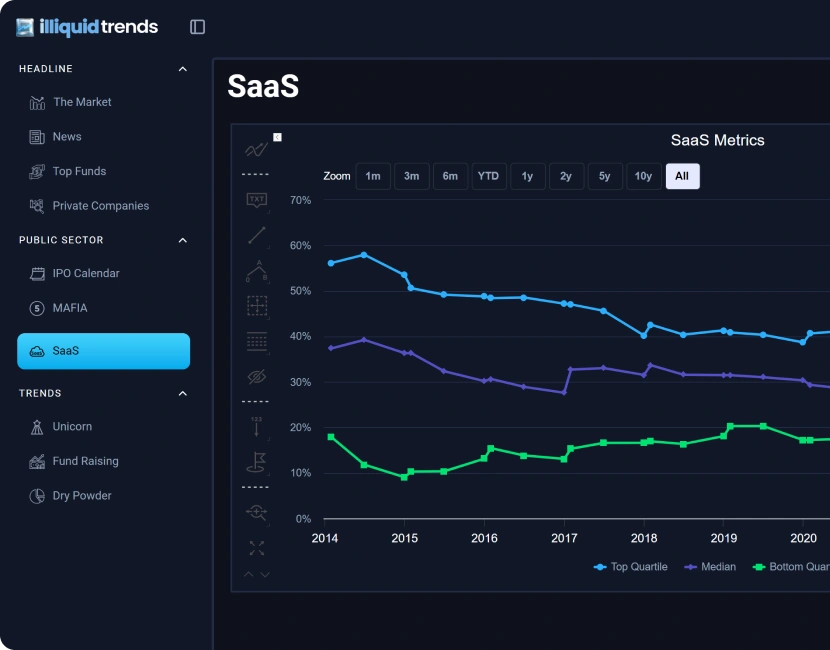
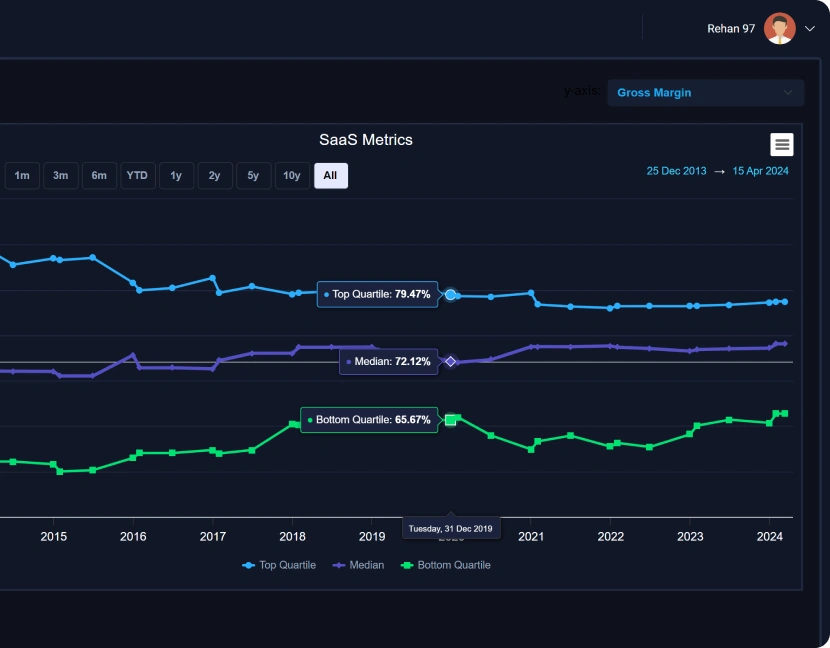
Evaluate Gross Margin performance through our interactive graph. Compare profitability levels, assess cost structures, and gain insights into operational efficiency across SaaS companies.
Create graph templates in a flash and share them at will.
Customize charts to suit your investment style.