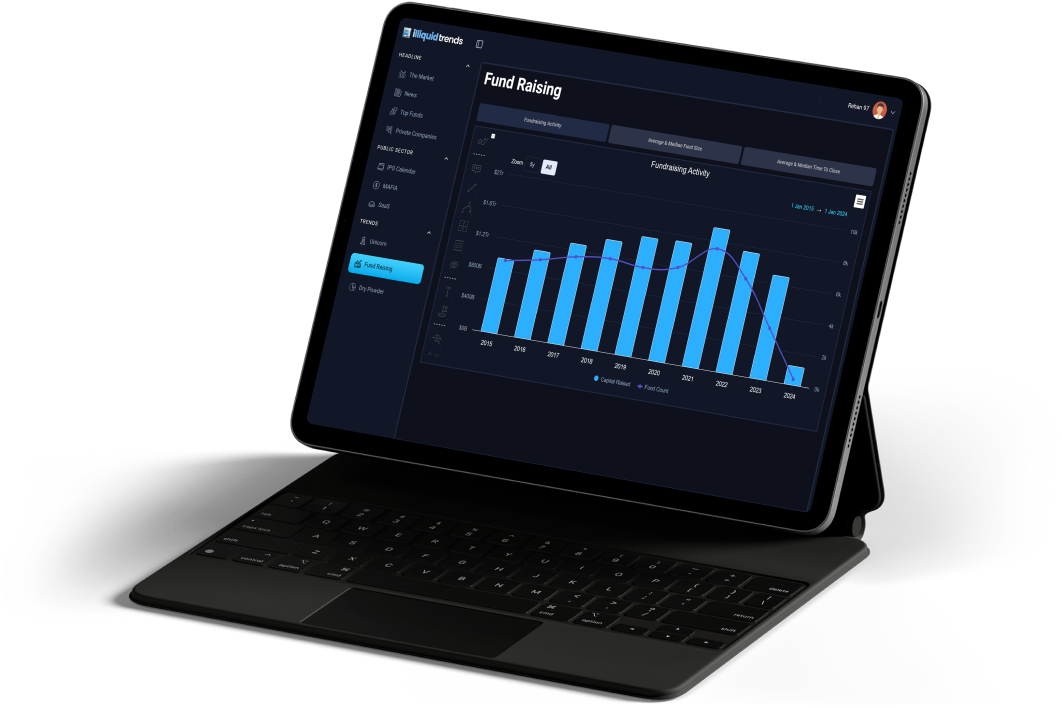
Discover essential metrics and trends through interactive graphs to optimize your fundraising strategies and achieve strategic growth in the competitive landscape.

Intuitive features put you in control of full market data. See more of what matters to you, in less time.
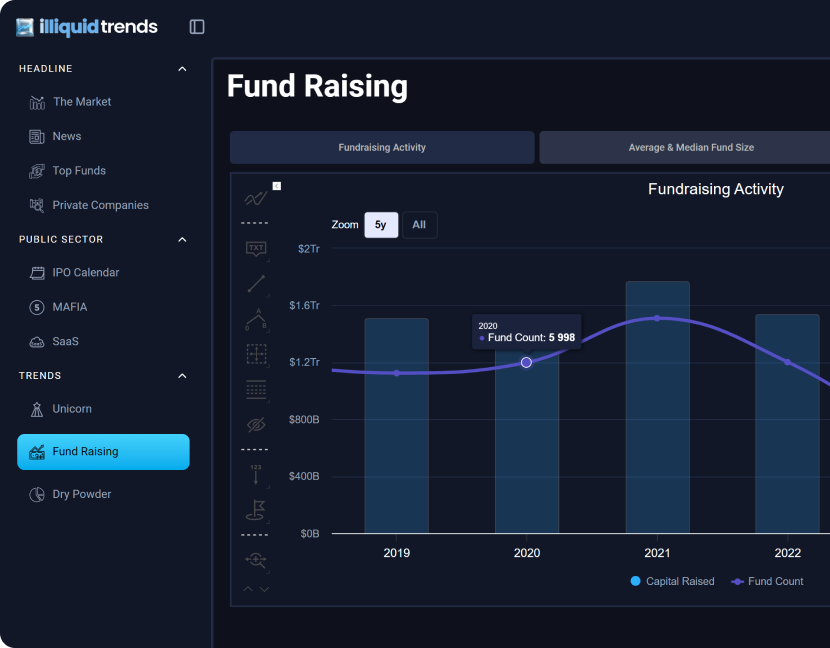
Monitor fundraising activity in real time with our interactive graph. Stay informed about funding rounds, investment amounts, and investor participation, enabling you to make informed decisions and capitalize on market opportunities.
Create graph templates in a flash and share them at will.
Customize charts to suit your investment style.


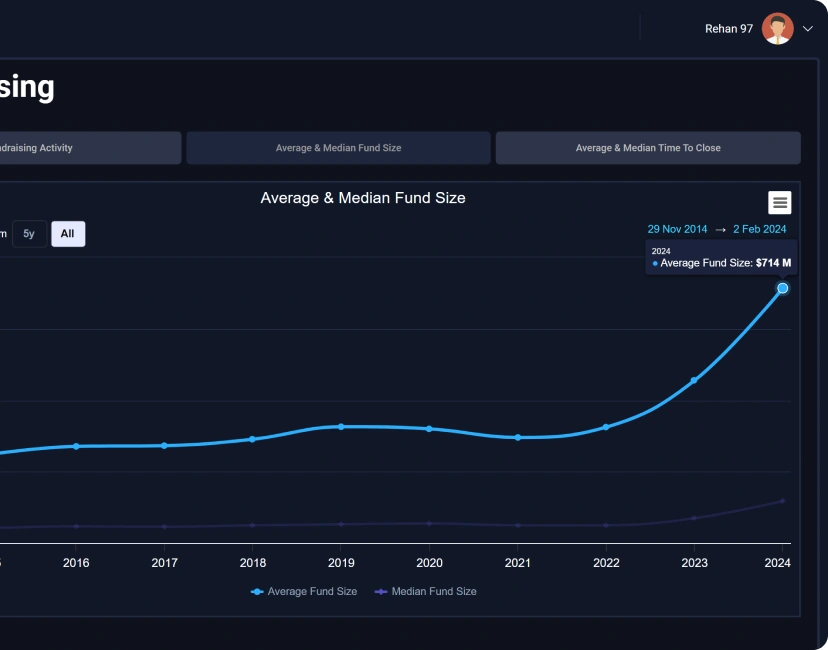
Analyze average and median fund sizes across different funding rounds with our interactive graph. Gain insights into fund size trends, investor expectations, and funding strategies, helping you optimize your fundraising targets.
Create graph templates in a flash and share them at will.
Customize charts to suit your investment style.
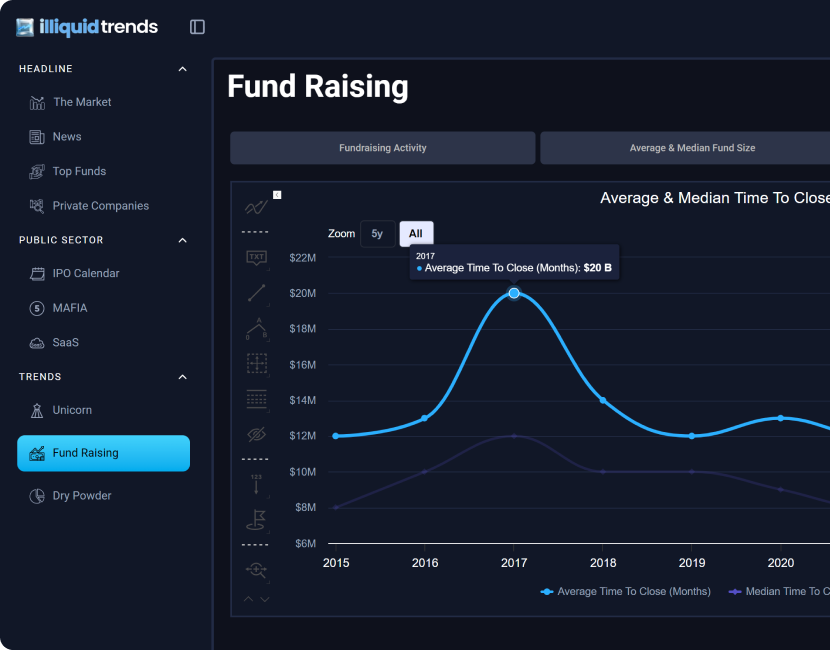
Assess average and median time to close funding rounds with our interactive graph. Understand the efficiency of your fundraising processes, identify areas for improvement, and streamline your fundraising timelines for optimal results.
Create graph templates in a flash and share them at will.
Customize charts to suit your investment style.
